

Large clusters of solar power stations
In the last of the series, solar pioneer Philip Wolfe looks at areas where solar generating stations are clustered together, without the coordination of organised solar parks.
We have seen that the world’s largest individual solar power plants now have AC capacity in excess of 1 GW. Meanwhile, solar parks, where several projects are co-located in one organized site, are expanding from about 3 GW towards 5 GW or more.
This ‘solar park’ model is most widely adopted in China, India, and the Middle East, where the electricity industry is highly regulated. In other countries, notably the U.S., where the power market is more liberalized, solar projects also sometimes congregate together around the best locations, but without the formal coordination that solar parks offer. We call these groups of neighboring plants ‘solar clusters’.
Solar clusters typically form in areas where the available grid connection capacity and sunlight levels are favorable. This article looks at some of the largest clusters, though size is more subjective because it depends on how wide an area is included. For consistency, I have totaled the capacity of all plants within a 50 km (31 mile) radius.
This list shows clusters above about 1.5 GWAC, together with (in brackets) the position each held when last published in 2019.
1. Phalodi, Rajasthan, India 6.6 GWAC (4)
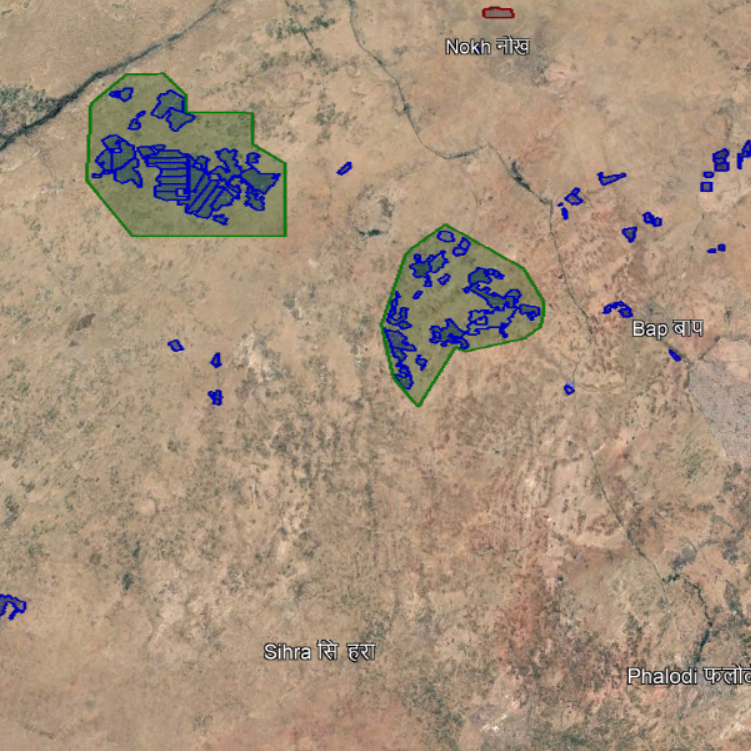 The arid region north of Phalodi in India’s Jodhpur district hosted some of India’s earliest utility-scale solar power projects, dating back to 2011. Today it accommodates two solar parks and a growing number of smaller individual solar plants. The Godawari CSP plant at Nokh is also included this cluster (see the red outline near the top).
This cluster’s rise up the table is thanks to new plants at both the Bhadla Solar Park, currently #2 in the world, and Rawra Solar Park, which has now climbed to #6. Between them, the parks house seven 300 MW projects supplying power to India’s ISTS (Inter-State Transmission System).
Other standalone solar plants in the area – including the 600-MW Lawan-Purohitsar station further south, now ranked #9 in the world – take the total number in this cluster to 90 with a combined capacity of some 6.6 GW – about the same as the national totals for France or Australia.
Further plants are under development in the district and are expected to take the total capacity of this cluster over 8 GW. Another cluster further east in Rajasthan, the area around Jamsar, houses over 1 GW of plants and is expected to rise to 2.5 GW in coming years.
2. Gonghe, Qinghai, China 5.1 GW (6)
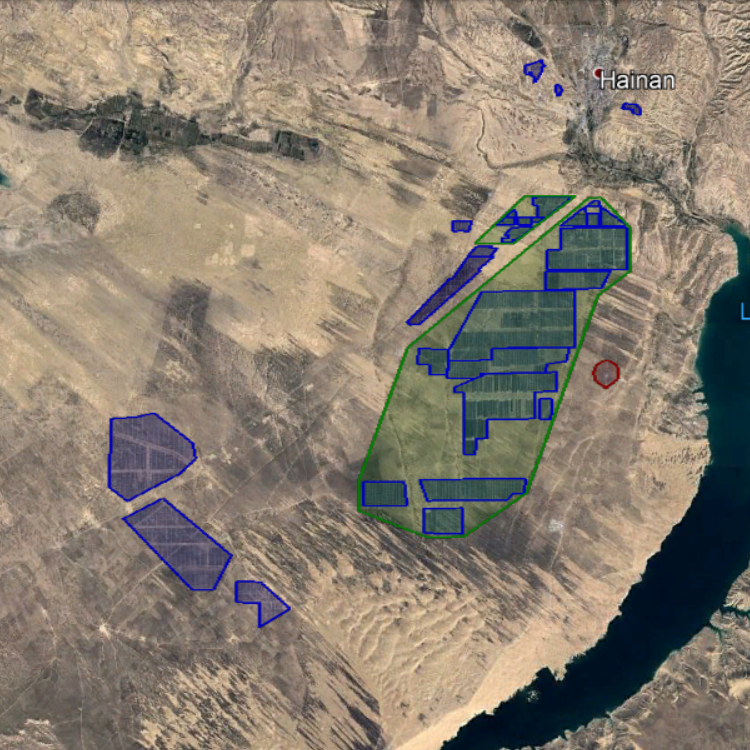
Gonghe County in Qinghai’s Hainan Prefecture, China, looks like the world’s ‘giga-solar capital’. Readers of the previous articles in this series will not be surprised to see it near the top of this list.
Though the cluster holds only 18 plants, they include the world’s #1 plant Huanghe Hydropower Developments’ 2.2 GW monster and Longyangxia Solar-Hydro, now listed as the #3 biggest solar park in the world. A handful of other nearby plants take the total capacity of this cluster to 5.1 GW.
New recently installed transmission lines taking the power over 1,000 kilometres east to Beijing make this a prime location for a renewable energy cluster.
3. Imperial Valley, California 2.8 GW (5)
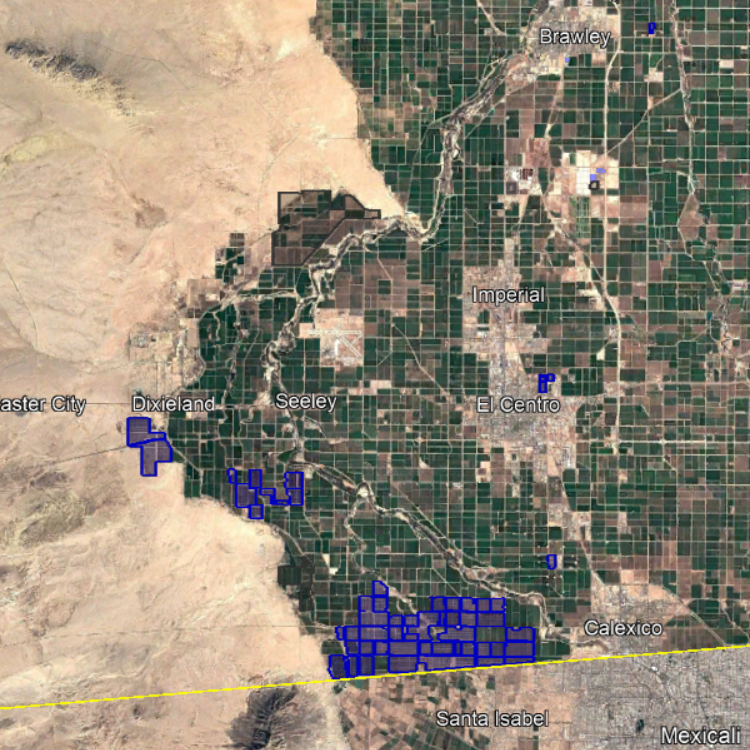 Imperial County borders Mexico at Mexicali and has become home to many solar projects, including the multi-phase Mount Signal, Centinela and Imperial Valley projects.
Recent expansions to these plants have increased the total capacity to some 2.8 GW, shooting Imperial Valley up this list. Projects still in development should take the eventual total towards 5 GW.
Unlike the previous clusters in arid and desert regions, this is relatively fertile land, making the solar arrays (bordered in blue) harder to spot in this aerial view.
4. Ninh Thuan, Vietnam 2.6 GW (-)
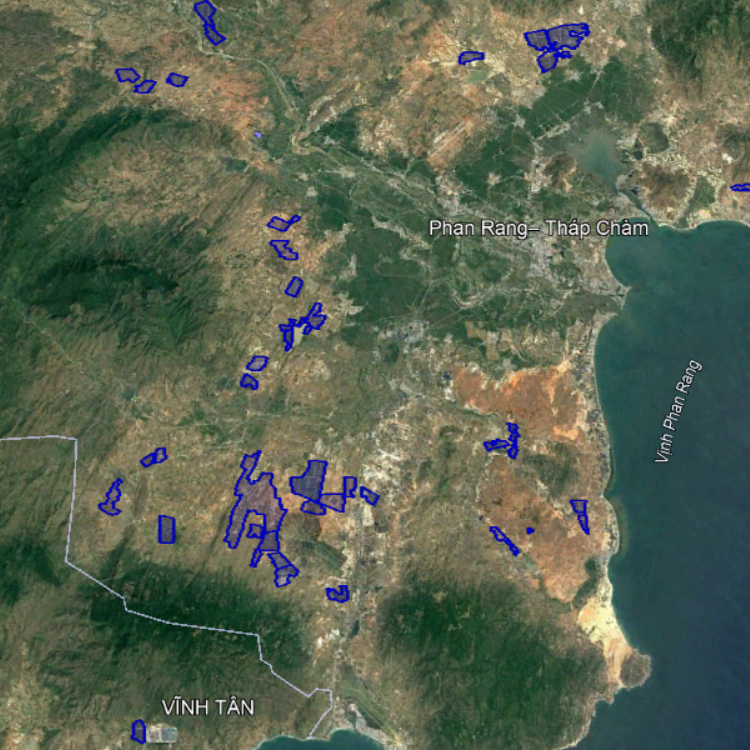
It is a sign of how fast Vietnam’s renewables market has progressed that it has now broken into this list. When it was last published in 2019, the whole of Vietnam had less than 1 GW of utility-scale solar.
The southern part of Ninh Thuận province now houses 40 plants with a combined capacity of 2.6 GWAC. The largest plant is Trung Nam Group’s 450 MW plant at Phươc Minh.
Around 12⁰ latitude, this is the first of only two clusters in the top 10 outside the subtropics; all the others are between latitudes 27⁰ and 38⁰N.
5. Antelope Valley, 2.5 GW (1)
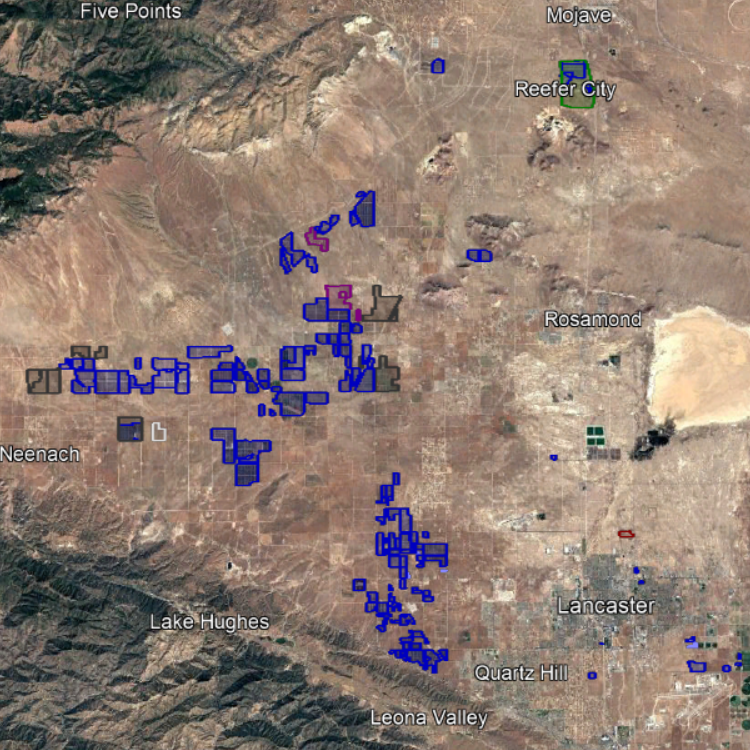
A second California valley is heading towards 5 GW – this one to the west of the Mojave Desert and north of Los Angeles, Its sunny location is boosted by good connectivity to the electricity markets of south and central California.
Amongst the 70 solar projects in Antelope Valley is the U.S.’s second-largest PV power plant, Solar Star, ranked #10 in the world.
Total connected capacity in this district currently stands at 2.5 GW.
6. Zhangbei, Hebei, China 2.1 GW (-)
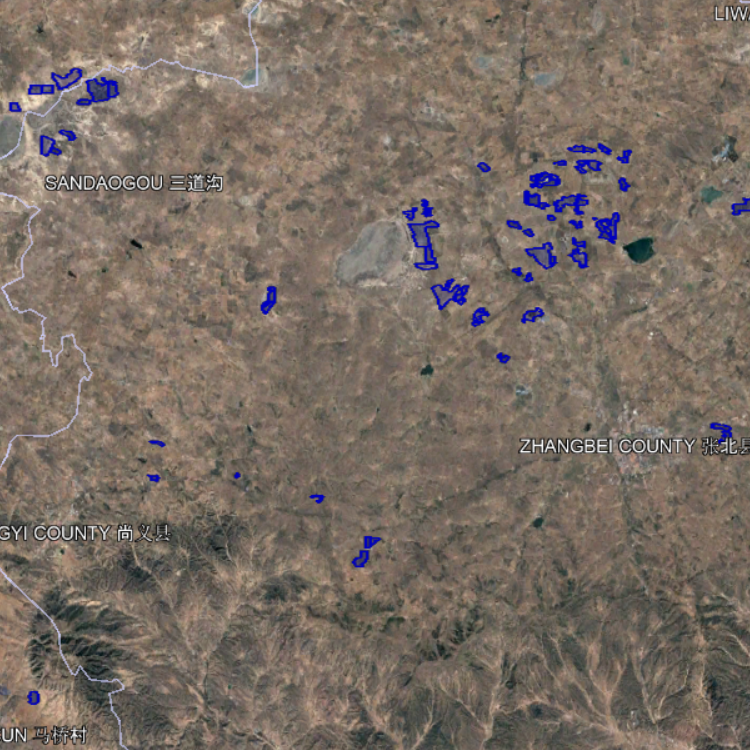
The other cluster outside the subtropics, centered in Zhangbei County of Zhangjiakou in China’s Hebei province is just north of 41⁰N. It houses 1.8 GWAC of utility-scale solar from about 50 projects, a few of which are in neighboring Shangyi County and just over the provincial border in Inner Mongolia. However, the biggest concentration is in the municipality of Gonghuizhen.
Three CSP projects totaling 150 MW were also scheduled to be built in this area, but do not appear to have been completed yet.
7. Jinchang, Gansu, China 1.7 GW (2)
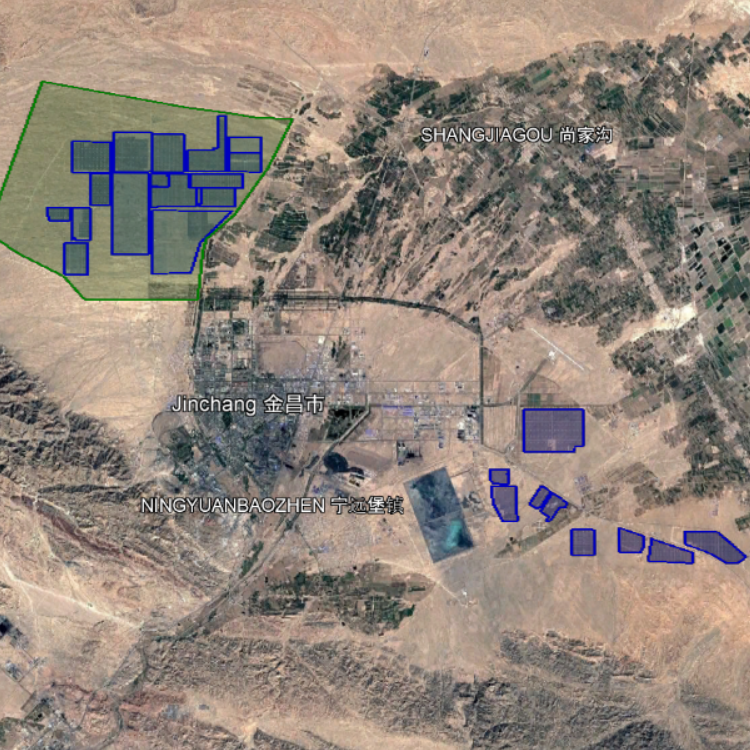
The area around the city of Jinchang, also in China, accommodates, in addition to the world’s #5 solar park to the northwest, several more solar plants to the southeast, the largest of which is 200 MWP. The combined capacity of this cluster is 1.7 GW, and that can be expected to rise if Jinchuan Solar Park is further built out. However, no new capacity has been added in this cluster since the list published in 2019.
8. Zhongwei, Ningxia, China 1.5 GW (-)
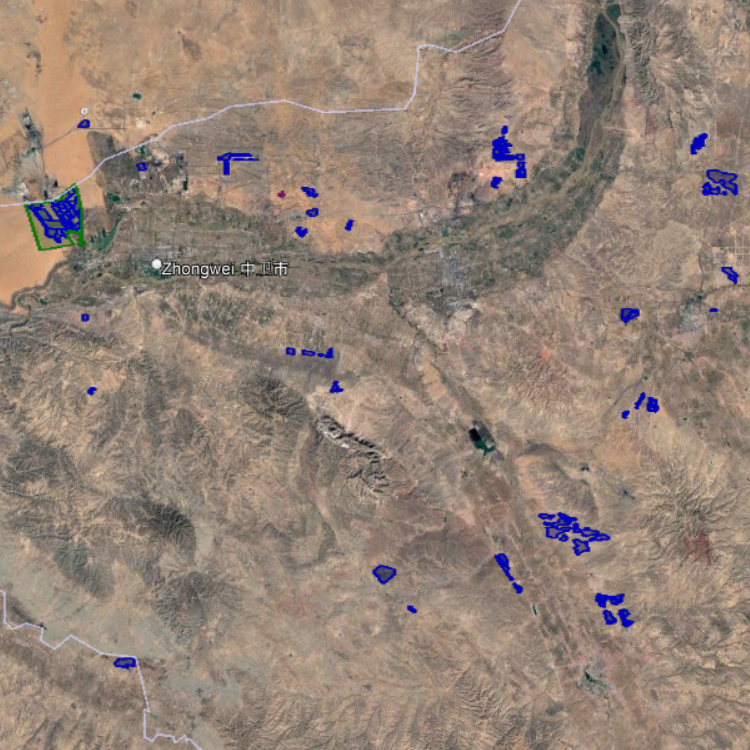
Zhongwei County in Ningxia is home to Tengger Desert Solar Park – once the world’s largest, but now down at #14. The area also has a few concentrations of individual solar plants, most notably around Zhongning, Hongsibu and Tongxin.
In total, the cluster houses 45 plants with a combined capacity of 1.5 GWAC.
9. Eldorado Valley, Nevada 1.4 GW (3)
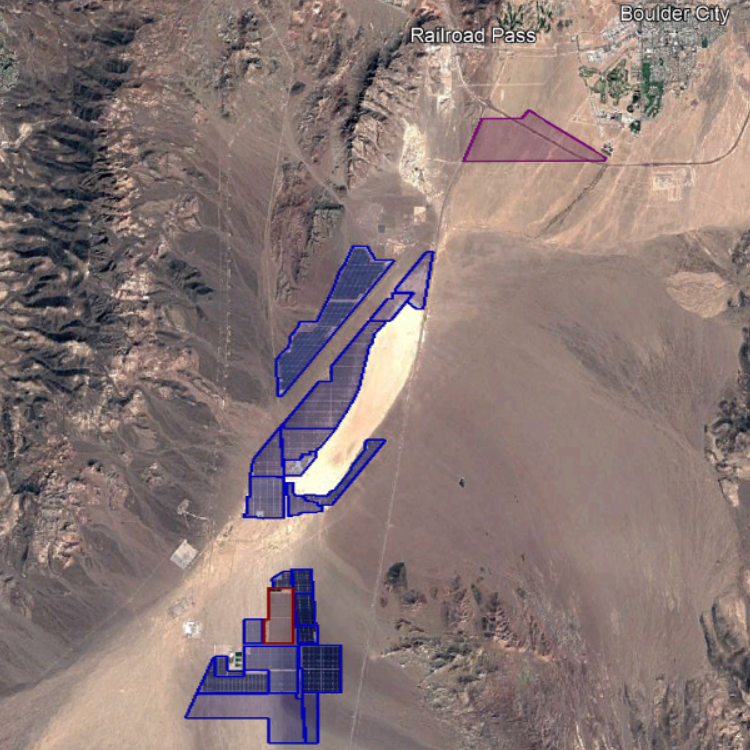 In the desert to the south of Las Vegas, around Eldorado Dry Lake are clustered several large solar plants, including the multi-phase Copper Mountain PV project – now #4 in the world – and the Nevada One CSP plant.
Visible in the south-western part of this view are the facilities that make this area so attractive to solar developers – the three high capacity electricity substations and the power lines heading north to power-hungry Las Vegas and southwest to California.
The combined capacity is currently 1.4 GW, with further projects under development.
Elsewhere in the world
The list shows that the cluster approach is best suited to less densely populated regions of countries with high energy consumption. It can be expected to spread to parts of South America, Australia, and southern Africa. For example, the areas around Calama and Diego de Almagro in Chile already hold half-GW clusters, which are due to increase substantially.
Europe’s larger solar markets do not have many wide-open spaces available. Typical plant and cluster sizes are smaller, like those in Germany’s Brandenburg, France’s Landes, and Montalto di Castro in Italy. Rapid market growth may make Spain an exception, however. Teruel already hosts a ¾-GW cluster, and this is scheduled to grow to 2.6 GW.
Terminology and acknowledgments
The term ‘solar plant’ is used for an individual project that has been developed by a single developer or consortium. The largest of these were listed in an earlier article. Where multiple plants are co-located in a discrete area under the coordination of an identified agency, this is called a solar park, as described in the previous article. Today’s article explains how I use the word cluster where multiple solar farms are sited in an area without formal coordination.
Image Credits: The satellite views are from Google Earth, using imagery from Airbus, CNES, Copernicus, Digital Globe, and Landsat. In these shots, individual plants are highlighted in blue (if PV, or red if CSP), with solar parks in green. Colour coding on Wiki-Solar’s maps is similar.
Also for consistency, all capacities are quoted in MW/GWAC to allow direct comparison between PV and CSP plants (and other forms of generation). Readers will be aware that the DC peak capacity of PV plants is typically ~25% higher than the rated AC capacity, quoted here.
About the author
Philip Wolfe has been active in the renewables arena since the 1970s and is the founder of Wiki-Solar. His book on utility-scale solar was published in 2012 and one on the early years of the terrestrial PV sector was published in 2018.